

SBA Releases PPP Data
By: Greggory B. Oberg, Esq.
Chopping Up the PPP Data
In what the news articles I've read tell me is a "shocking reversal", the SBA has performed a basic function of government by granting us the ability to see raw data behind where over $500 billion taxpayer dollars went under the PPP program. Up until now, all we really knew about PPP funding was (1) the rollout was a mess; (2) a lot of money went out; and (3) fraud, waste, and other fiduciary issues have almost certainly transpired. It's all but certain we'll be seeing headlines and litigation on this program for the foreseeable future, After all, Wells Fargo was allowed to originate these loans.
That's not what I want to discuss today. Instead, I wanted to focus on the PPP data dump from a regional perspective (sorry, by "regional" I mean MA, like most things "New England"), and see how the windfall of origination fees were distributed across our customer base.
As many of you remember, these relatively light lift loans came with a flat rate origination fee to the lender based on the loan amount. The cut is as follows:
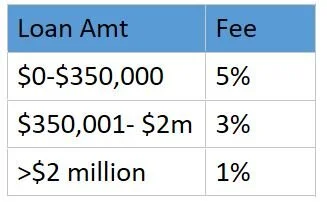
That adds up to some real cash in our pockets as small, community focused lenders. In a way, this was the back door stimulus to the banking community that nobody really saw coming. Wonder if it balances out the losses on mortgage forbearances for some of us…
Aggregate Lending Figures
SBA confirms the previously reported aggregate figures, totaling over $520 billion. A little under 5,500 lending outlets originated at least one PPP loan, for a total of just under 5 million loans. This is obviously a massive, order-of-magnitude shift from SBA's previous annual lending totals…a point to keep an eye on moving forward. The PPP program purports to have supported over 51 million jobs, a figure representing as much as 84% of all qualifying "small business" employees. As stated by the SBA, "[a]cross all 50 states, 72 to 96 percent of small business payroll” was covered by the PPP during applicable periods; with Rhode Island coming in at 83%. The remainder of the New England states totaled in the 70-19% range.
Zooming Down
I thought I'd take a deeper dive into some lender-specific and loan amount-specific trends, see if I could get a better picture of the life preserver CARES tossed to community banks.
Who Originated PPP Loans?
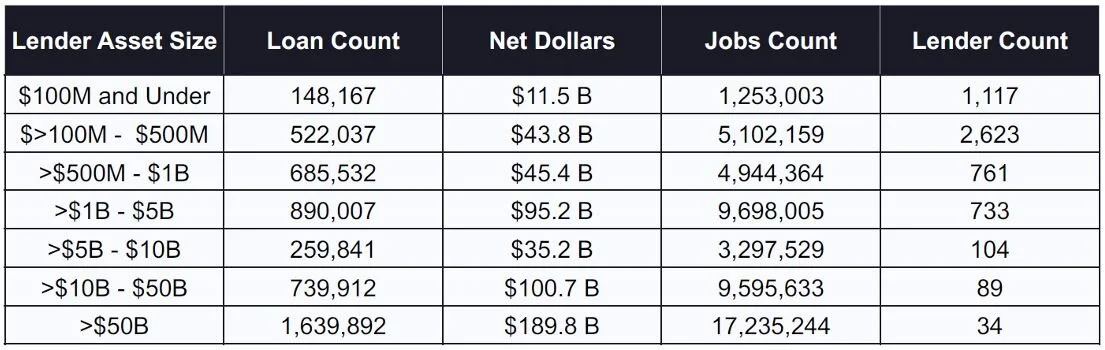
As is to be expected, the big boys lead the way, with the top five lenders by net dollars accounting for roughly 17% of PPP funds disbursed--or about $90 billion. The relatively wide category of "lenders size <$10 B in Assets accounted for a plurality of the dollars disbursed, with 44% of volume as compared to the aforementioned second-ranking "Lenders w/ >$50 B in asset", accounting for 36%. The remaining asset group accounted for just under 20%.
Within the ">$10b" range, SBA further broke down data as follows:
Where PPP Loans Concentrated, New England Region
In alphabetical order:

How Big Was the Average PPP Loan?
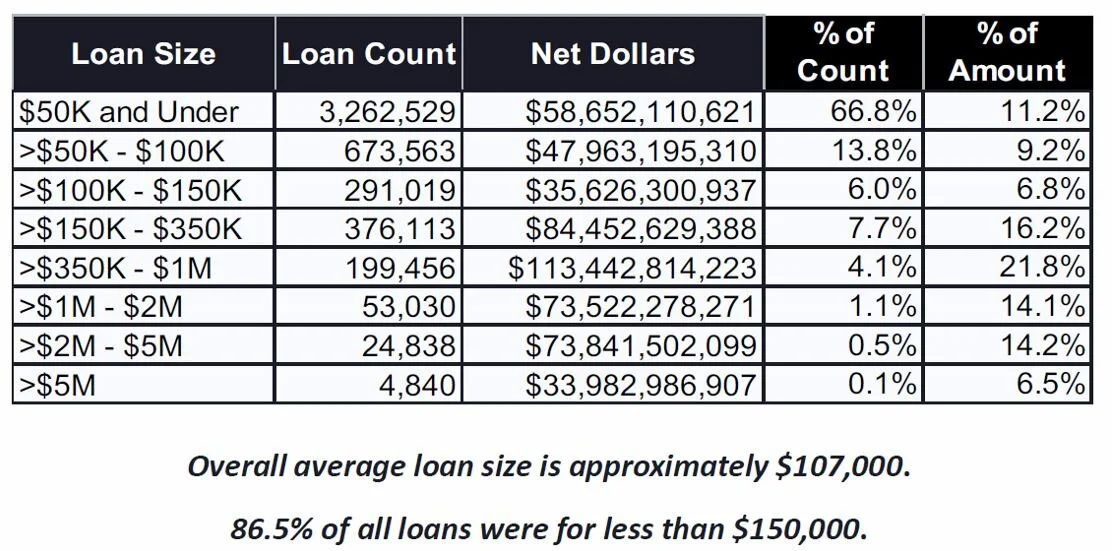
As a reminder, the thresholds above on lender compensation are different then the ranges the SBA chose to report in this instance; so a little math is needed. While the overall report offered by SBA is useful, I found myself wanted more and jumped into the data a bit.
Into The Weeds: MA Data Analysis
For my fellow "big data" geeks, the SBA has provided a massive dump of raw data on the PPP program, which is relatively well organized by state. The only negative here is that, for whatever reason, those loan amounts >150k are separated from the smaller loans. So much so that you get different date on the larger loans. With respect to loans <$150k, available data of note include:
Town/City;
NACIS Code of Borrowing Entity;
Ethnicity, Gender, and Veterans Status (if reported by applicant/borrower);
Number of Jobs Retained; and
Loan Amount.
Things get a bit more interesting on loans of >$150k; as the public file contains the loan amount in banded ranges, but provides the name of the recipient.
While these differences in data make it practically impossible to put a total figure on the compensation paid to lenders, we can get an exact figure in the <150k loan amount range, and somebody better with statistics than I can estimate the compensation based on the >150k ranges. Some serious assumptions will be necessary in the latter grouping.
But as for the former, within specifically the MA market, the data shows that just under 95,000 of these loans were made, at a total of slightly above $3.5 billion. Based on the 5% commission on these sub-$350k loan amounts, MA lenders making loans to MA companies earned roughly $176.5 million in commissions during this gold rush.
Add to this the roughly 19,000 loans of >$350k at commissions of 3% or 1%, based on above thresholds, and the figure is quite a big bigger.